MADByTE uses several orthogonal NMR experiments to derive as much knowledge from complex mixtures as possible.
Metabolomics
MADByTE uses two types of experiments for processing - HSQC (Heteronuclear Single Quantum Cohearance) and TOCSY (TOtal Correlation SpectroscopY). These experiments offer up orthogonal information about molecular connectivity, and inform investigators about a given proton’s correlation to a connected Carbon, and the spin system it belongs to. Using these data for pure compounds, a good portion of the molecular structure can be derived. Working with mixtures, however, presents a few challenges - solving full structures de novo in a mixture can be extremely challenging, and is currently impractical.
So don’t.
Instead, use the power of your sample size to drive the discovery.
MADByTE’s strategy builds on the idea that if a metabolite is shared between samples, there will be shared spectral features that accompany it. This is a common approach to many Natural Products investigations, but largely have been utilized mass spectrometry based platforms (such as dereplication protocols[1], several of which have revolutionized the way comparative metabolomics have enabled discovery efforts to compare samples to other data sets to hone in on the shared features that make up molecular fingerprints[2].
MADByTE workflow consists of 4 tasks:
Data Acquisition
Generation of Spin System Features
Comparison of Features
Association Networking

Step 1: Data Acquisition
Heteronuclear Experiments:
Data acquisition for MADByTE requires basic, routine, and well established experiments. The HSQC experiment provides direct H-C correlations which are used in the downstream assembly of the spin system construction. Importantly, the HSQC provides a boost in resolution of resonances by ‘spreading out’ the information along the Carbon axis as well. This provides the starting point for analysis and comparison by anchoring proton resonances to their carbon positions.
Homonuclear Experiments
MADByTE is capable of using both COSY and TOCSY data to construct spin system features. However, by using TOCSY over COSY, the spin systems derived are more robust and the chance for noise to be integrated in is less - find out why in an upcoming blog post about MADByTE data filtration. Using the proton-proton correlations in the homonuclear data, MADByTE builds spin systems that are representative of molecular ‘fragments’ which ultimately will be used to associate features together.
Peak Picking
“Data is a signal in the eye of the spectroscopist”, and what data is important is up for a long and lengthy debate - which I’m happy to have. In 2D NMR of crude mixtures, it can be an extremely daunting task to peak pick relevant peaks while excluding instrument noise and banding that can arise. Worse, the shapes of multiplets can come through in 2D experiments. Because of this, MADByTE does not do the peak picking for the investigator. Instead, it assumes the investigator has used a peak picking strategy that they are comfortable with and can tell the caveats of.
This means that as long as you can process your data with a software you feel comfortable with, you can pass it into MADByTE. Simply export the peak lists as CSVs and ensure they are in the relevant structure (tools to convert for you are incoming).
Step 2: Creation of Spin system features
Using the data provided, MADByTE constructs the longest spin systems possible from the TOCSY or COSY data and then associates those protons with their corresponding HSQC crosspeaks. This means that no spin system feature will represent the whole of the molecule in question. Instead, a single molecule can be thought of as a collection of features.

Using erythromycin as an example, the main scaffold core is broken up into 4 sections which would each give rise to a unique spin system feature that, as a collection, can be used to determine scaffold similarity of an unknown metabolite to the core scaffold. Although not directly analogous, you can think of it like observing molecular fragmentation in mass spectrometry - a molecular entity is the sum of its fragments.
For every sample, a database is constructed of all the Spin System Features we observe within that sample, and a second global database is updated to contain these as well. The number of features generated is directly related to several factors, most importantly the sample complexity and dynamic range of the data. Overlapping regions (especially in the alaphatic parts of the NMR data) are often un-resolvable and instead rely on downfield correlations from TOCSY for construction of the features. In cases where a resolved feature cannot be established, it is dropped from comparative analysis.
Comparison of Spin System Features
“One may not rely on sample purity, nor on high quality of the spectra! The presence of impurities and artifacts is a rule and all evaluation algorithms–including fitting –must be «resistant» to them. ”
Comparison of the spin system features to each other relies on the investigator. There are no ‘magic parameters’ that enable every sample to be directly comparable. NMR, although universal and noted as highly reproducible, has its drawbacks. In the context of MADByTE, this means that not every single spin system should be expected to be seen, and not every spin system will match perfectly. However, this is why using the TOCSY and HSQC is important. Signals in NMR are products of both their internal and external chemical environment; concentration, acidity, temperature, etc.. can all affect the chemical shift positioning of protons. However, the extent of that effect has the potential to effect the entire spin system less than any one individual proton. Because of this, using the entire spin system feature as a basis for comparison provides some ‘wiggle room’ for analysis, and how much wiggle room is provided to the platform is under the users control.
The feature comparison is done by comparing each proton-carbon association in a spin system to each other proton-carbon association in every other spin system ever observed. If enough of these proton correlations match (known as the similarity cutoff), then the systems are seen to be similar and the end network will associate them together.
Association networking
Each sample is a collection of its features. To visualize this, we generate a sample ID node that anchors all associated spin systems from that sample together.

Once the spin system features have been compared to each other, the final step is to network the associated spin systems together. Taking erythromycin and azithromycin together (see below for the Full Association Network), one can see that their overall scaffolds look very different. However, the chemical environments that make them up are more similar than one would suspect. We compare these spin systems together and find out that a few of them have spin systems whose comparative scores are higher than that of the similarity cutoff and an edge is drawn between the spin system nodes.
Types of networks
MADByTE outputs the association network in a variety of ways that can be useful, depending on the motivation of the investigator. The Full Association Network and the Hybridized Association Network are automatically generated for all networks and output is available in the graphML file type for downstream use in Cytoscape or Gephi.
Three options in use currently are:
Full Association Network - Shows all nodes generated from all samples and direct comparison
Similarity Network - Visualizes all nodes which share similarities only. Does not render unique feature nodes.
Hybrid Network - Combines features of shared nodes found in both/all systems.

Full Association Network
The Full Association Network generates comparison of all nodes from each sample and renders the network, which provides the graphical basis for all downstream networks.
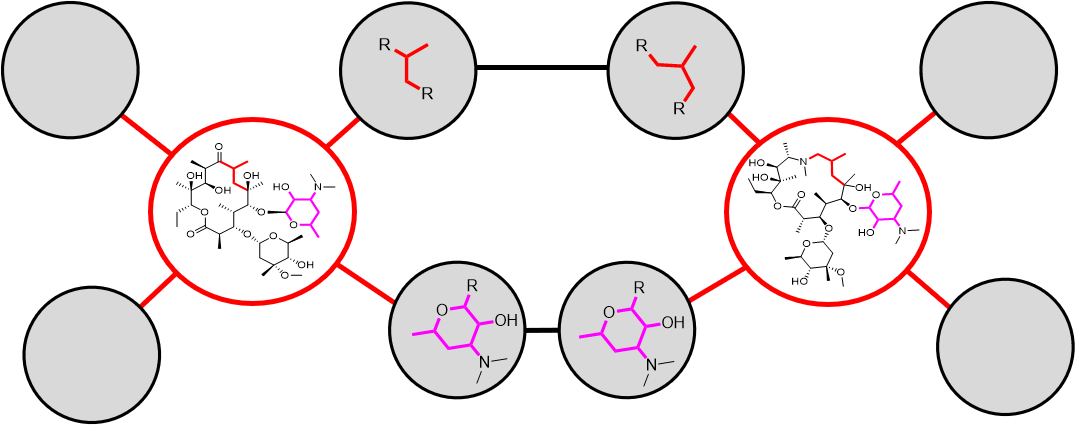
Full Association Network rendering strategy: All nodes representing observable spin system features are compared, associated, and rendered. Actual nodes are collections of coordinate points, not structural drawings. Hypothetical rendering with Erythromycin (left) and Azythromycin (right).
All edges between nodes rendered in MADByTE are weighted based on their proportional overlap such that the distance between any two nodes is the product of their weighted edges and the edge weights from other nodes (which drag them around in other directions). This means that extract nodes that share similar chemistry will find themselves gravitated more towards more similar samples.
The net result is a map of all shared chemical environments from a sample library point of view. Using these data on their own, hypotheses about the importance of certain metabolites mapped by MADByTE can be made, and isolation efforts can be prioritized - long before any chromatography.
One obvious application of these data are to seed the library with already discovered compounds, which enables rapid dereplication. As an added bonus, since the spin systems do not have to be exact, any variations in analogs could be focused on, if that is the application of interest.
Hybridized Association Network

While the Full Association Network allows for visualization of all of the spin systems from every sample, sometimes this information can be overwhelming and complicate the downstream analysis. In order to facilitate rapid annotation of only the shared features, the Hybrid Association Network collapses spin system associations down to single node representations, and gathers the common information from every node that would be associated. The end result is a less complex visualization tool that shows only what features are truly shared between spectra.
Bioactivity Integration Network
In many natural product investigations, the end goal is to find a new component that displays a given bioactivity profile. Since MADByTE queries samples based on their similarity to each other, this provides an opportunity to survey the chemical landscape of many samples which display phenotypic profiles that are also similar. By using these data together, it is possible to elucidate - not only the shared chemistry - but the important shared chemistry.
MADByTE provides the opportunity to integrate bioactivity metadata and NMR feature data together to highlight bioactive extracts which display prominent activity. Using this as a prioritization step, the data suggests possible candidates for isolation. See an example under our Projects page.
Dereplication
Dereplication - a very popular natural products term - means to verify the presence of a chemical entity within a mixture in an effort to prevent re-disocvery of known chemistry [2]. This helps investigators to de-prioritize leads that contain already known compounds, which allows for the downstream pipelines to focus on new and novel metabolites. Other platforms have been constructed to annotate known metabolites based on centralized databases, such as BRMB, with primary metabolomics projects[3]. However, one cannot rely on the completion of a database when doing research, and instead, many labs have their own libraries of data to build upon. For this reason, MADByTE uses an ‘internal’ database for dereplciation - that is to say - each investigator can submit a peak picked HSQC of their data to query against. Moreover, by providing a customized library, problematic or promiscuous chemical entities can be ignored in a lab - or project - specific manner. In the future, if a robust and high quality database of larger metabolites can be constructed, MADByTE integration would be very simple[4-5].
Resources and Relevant Reading
1: GNPS - Mingxun Wang, Jeremy J. Carver, Vanessa V. Phelan, Laura M. Sanchez, Neha Garg, Yao Peng, Don Duy Nguyen et al. "Sharing and community curation of mass spectrometry data with Global Natural Products Social Molecular Networking." Nature biotechnology 34, no. 8 2016: 828. PMID: 27504778
DOI: 10.1038/nbt.3597
2: “El-Elimat, Tamam, Mario Figueroa, Brandie M. Ehrmann, Nadja B. Cech, Cedric J. Pearce, and Nicholas H. Oberlies. "High-resolution MS, MS/MS, and UV database of fungal secondary metabolites as a dereplication protocol for bioactive natural products." J Nat Prod 76, no. 9 2013: 1709-1716.
DOI: 10.1021/np4004307
3:Zhang, Fengli, and Rafael Brüschweiler. "Robust deconvolution of complex mixtures by covariance TOCSY spectroscopy." Angew. Chem. Int. Ed 46, no. 15 2007: 2639-2642.
4: J. B. McAlpine, S.-N. Chen, A. Kutateladze, J. B. Macmillan, G. Appendino, A. Barison, M. A. Beniddir, M. W. Biavatti, S. Bluml, A. Boufridi, et al.,”The value of universally available raw NMR data for transparency, reproducibility, and integrity in natural product research”Nat. Prod. Rep. 2019, 36,
DOI: 10.1039/c7np00064b.
5: Reher, Raphael, Hyun Woo Kim, Chen Zhang, Huanru Henry Mao, Mingxun Wang, Louis-Félix Nothias, Andres Mauricio Caraballo-Rodriguez et al. "A Convolutional Neural Network-Based Approach for the Rapid Characterization of Molecularly Diverse Natural Products."JACS 2020.
DOI: 10.1021/jacs.9b13786